
 Bitcoin
 Quack AI
 Pudgy Penguins
 Quantus
 Solana
 Injective
 NEAR Protocol
- Zoom Video Communications Inc. has witnessed a sudden decline in its profit margin.
- The ZM stock has been following a strong downtrend for a very long time.
The current CEO of the company is Eric S. Yuan and the company operates in packaged software industry. It has its headquarters in San Jose and it was founded in 2011. The company has 8.484K employees.
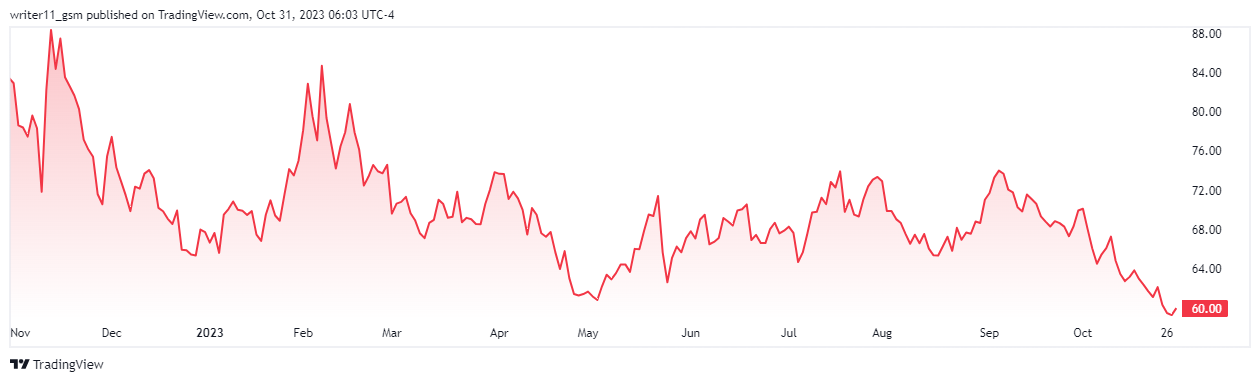
The ZM stock has made a 52-week range of $58.87- $89.67, the gross margin of the company is 73.83%. The reported EPS of the ZM share is 0.47 USD and the stock has a high PE ratio of 131.58. It can be a sign of the stock being overvalued.
The average trading volume of the ZM stock for the last three months is 3.263M. Also, the current market cap of the crypto is $17.852B. The operating margin of Zoom Video Communications Inc. is 15.60% and the P/B ratio of the company is 2.56.
Zoom Video Communications Inc. Financial Analysis
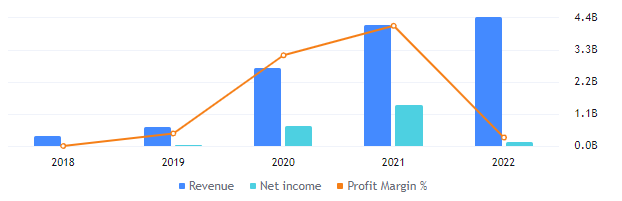
The reported revenue of Zoom Video Communications Inc. is $4.39B in the year 2022, which is higher as compared to the previous year resulting in $4.10B. Despite this, the profit margin of the company has declined from 33.54% in the year 2021 to 2.36% in 2022.
How Much More Dip Is Left In The ZM Stock?
a by writer11_gsm on TradingView.com
The ZM stock price has been following a strong downtrend since October 2020. It is because the stock hit its all-time high on the same day and since then it has been consistently declining.
After a huge decline of more than 85% in the stock price, it paused for a while. The ZM stock price tried to rise and formed a rising wedge pattern. Later the sellers again dominated the price and the share price broke down below the pattern.
The EMAs for the ZM stock are making a very good bearish pattern. The 50-day and the 200-day EMA values are declining with the decline in the stock price.
The RSI for the ZM stock is trading below the 50- level and has also hit the oversold zone of 30. It represents weakness in the stocks price and indicates that the stock is losing its momentum.
Conclusion
Despite of reliable financials of the company, the profit margin has witnessed a huge decline. The share price of the ZM stock is trading below the rising wedge pattern following a strong downtrend. The stock price still shows signs of declining to lower levels as there is no sign of buying in the stock.
Technical Levels
- Support levels- $50.00 and $55.00
- Resistance levels- $74.80 and $84.70
Disclaimer
The information provided in this article, including the views and opinions expressed by the author or any individuals mentioned, is intended for informational purposes only. It is important to note that the article does not provide financial or investment advice. Investing or trading in cryptocurrency assets carries inherent risks and can result in financial loss.




