
 Quantus
 Injective
 NEAR Protocol
 Sei
Sei Derive
 Bitcoin
 Zcash
Zcash
- WMT stock price has a beta of 0.49 which makes it less volatile than the whole market.
- Walmart Inc.’s share is following a very strong uptrend for a long time.
The WMT share is following a bullish trend and the price of the stock has been consistently advancing to higher levels for more than a year. Walmart Inc. has a market cap of $438.402 Billion resulting in 1.429 Billion shares floating in the market. The price-to-earnings ratio of the WMT stock is 31.39 which indicates that the stock price is fairly valued. This depicts that the investors are ready to pay more for the stock.
The WMT stock has an EPS of $5.22 which denotes the amount of money the stock is making on each share. The company has yielded a dividend of 1.40% to date followed by the last 12 months. WMT stock gave a total of $2.24 as a dividend to its shareholders in the year 2022. The company gave a dividend of 1.56% for the same year following a payout ratio of 52.43%.
The WMT share has been trading with an average volume of 5.465 Million and the last day trading volume of the share is 1.092 Million. The WMT share has also made a 52-week range between $136.09-$165.85.
Walmart Inc. (WMT) Stock Price Analysis
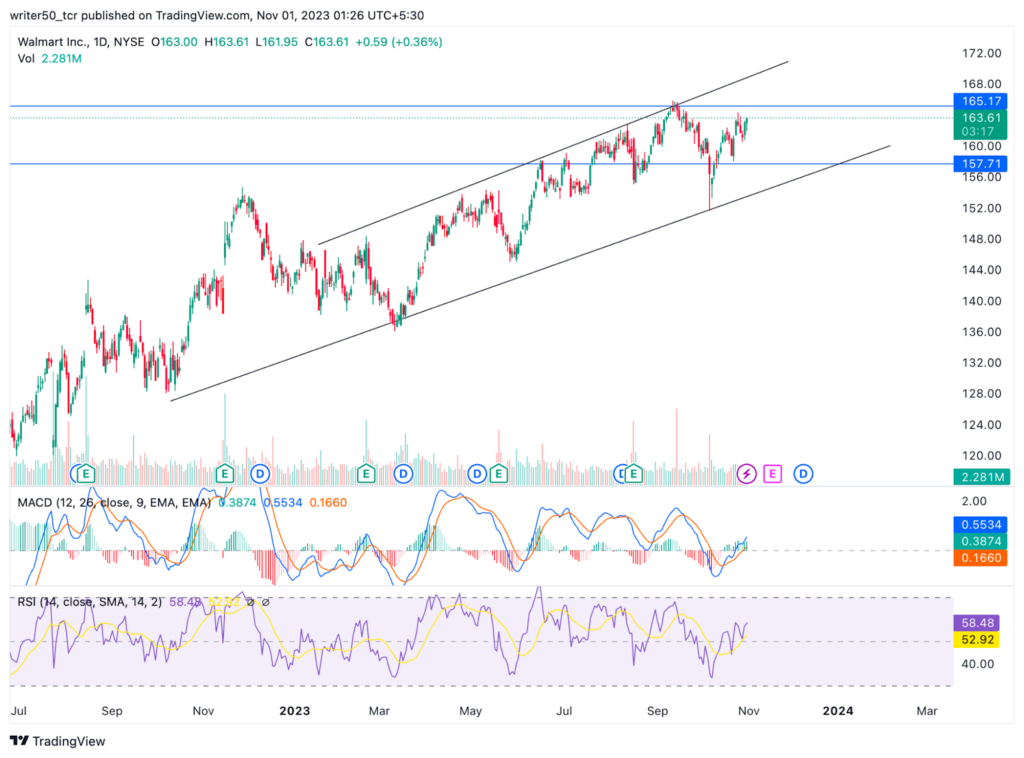
The WMT stock price is following a golden cross of EMAs on the charts. The share price is trading above the 50-day and the 200-day EMA. The WMT share is also consistently advancing to higher levels. The RSI for the Walmart stock is trading above the level of 50 and sustaining above the same. It has also crossed above the 14-day SMA which indicates bullishness in the market.
Conclusion
The WMT stock price is following an uptrend and the technical indicators are also supporting the ongoing uptrend. Therefore, the price of the stock might continue to advance to higher levels. It might hit the resistance levels in the upcoming days.
Technical Levels
- Support Levels – $153.30 and $158.20
- Resistance Levels – $165.00 and $185.00
Disclaimer
The views and opinions of the author, or anyone named in this article, are for informational purposes only. They do not offer financial, investment, or other advice. Investing or trading crypto assets involves the risk of financial loss.




